Dashboards everyone ignores aren't analytics. We build reporting and predictive models that answer the questions your leadership actually asks. Insights your teams act on, not data they scroll past.
Most enterprises have invested in BI tools. They have Power BI licenses. Tableau dashboards. Looker instances. And most of those dashboards sit unused.
The problem isn't the tool. It's what's behind it. Stale data. Metrics nobody defined. Reports that show what happened last quarter but not why. Visualizations that look good in a meeting but don't change a single decision.
Analytics works when it's built around the questions leadership actually asks. Not around the data that's easiest to display.
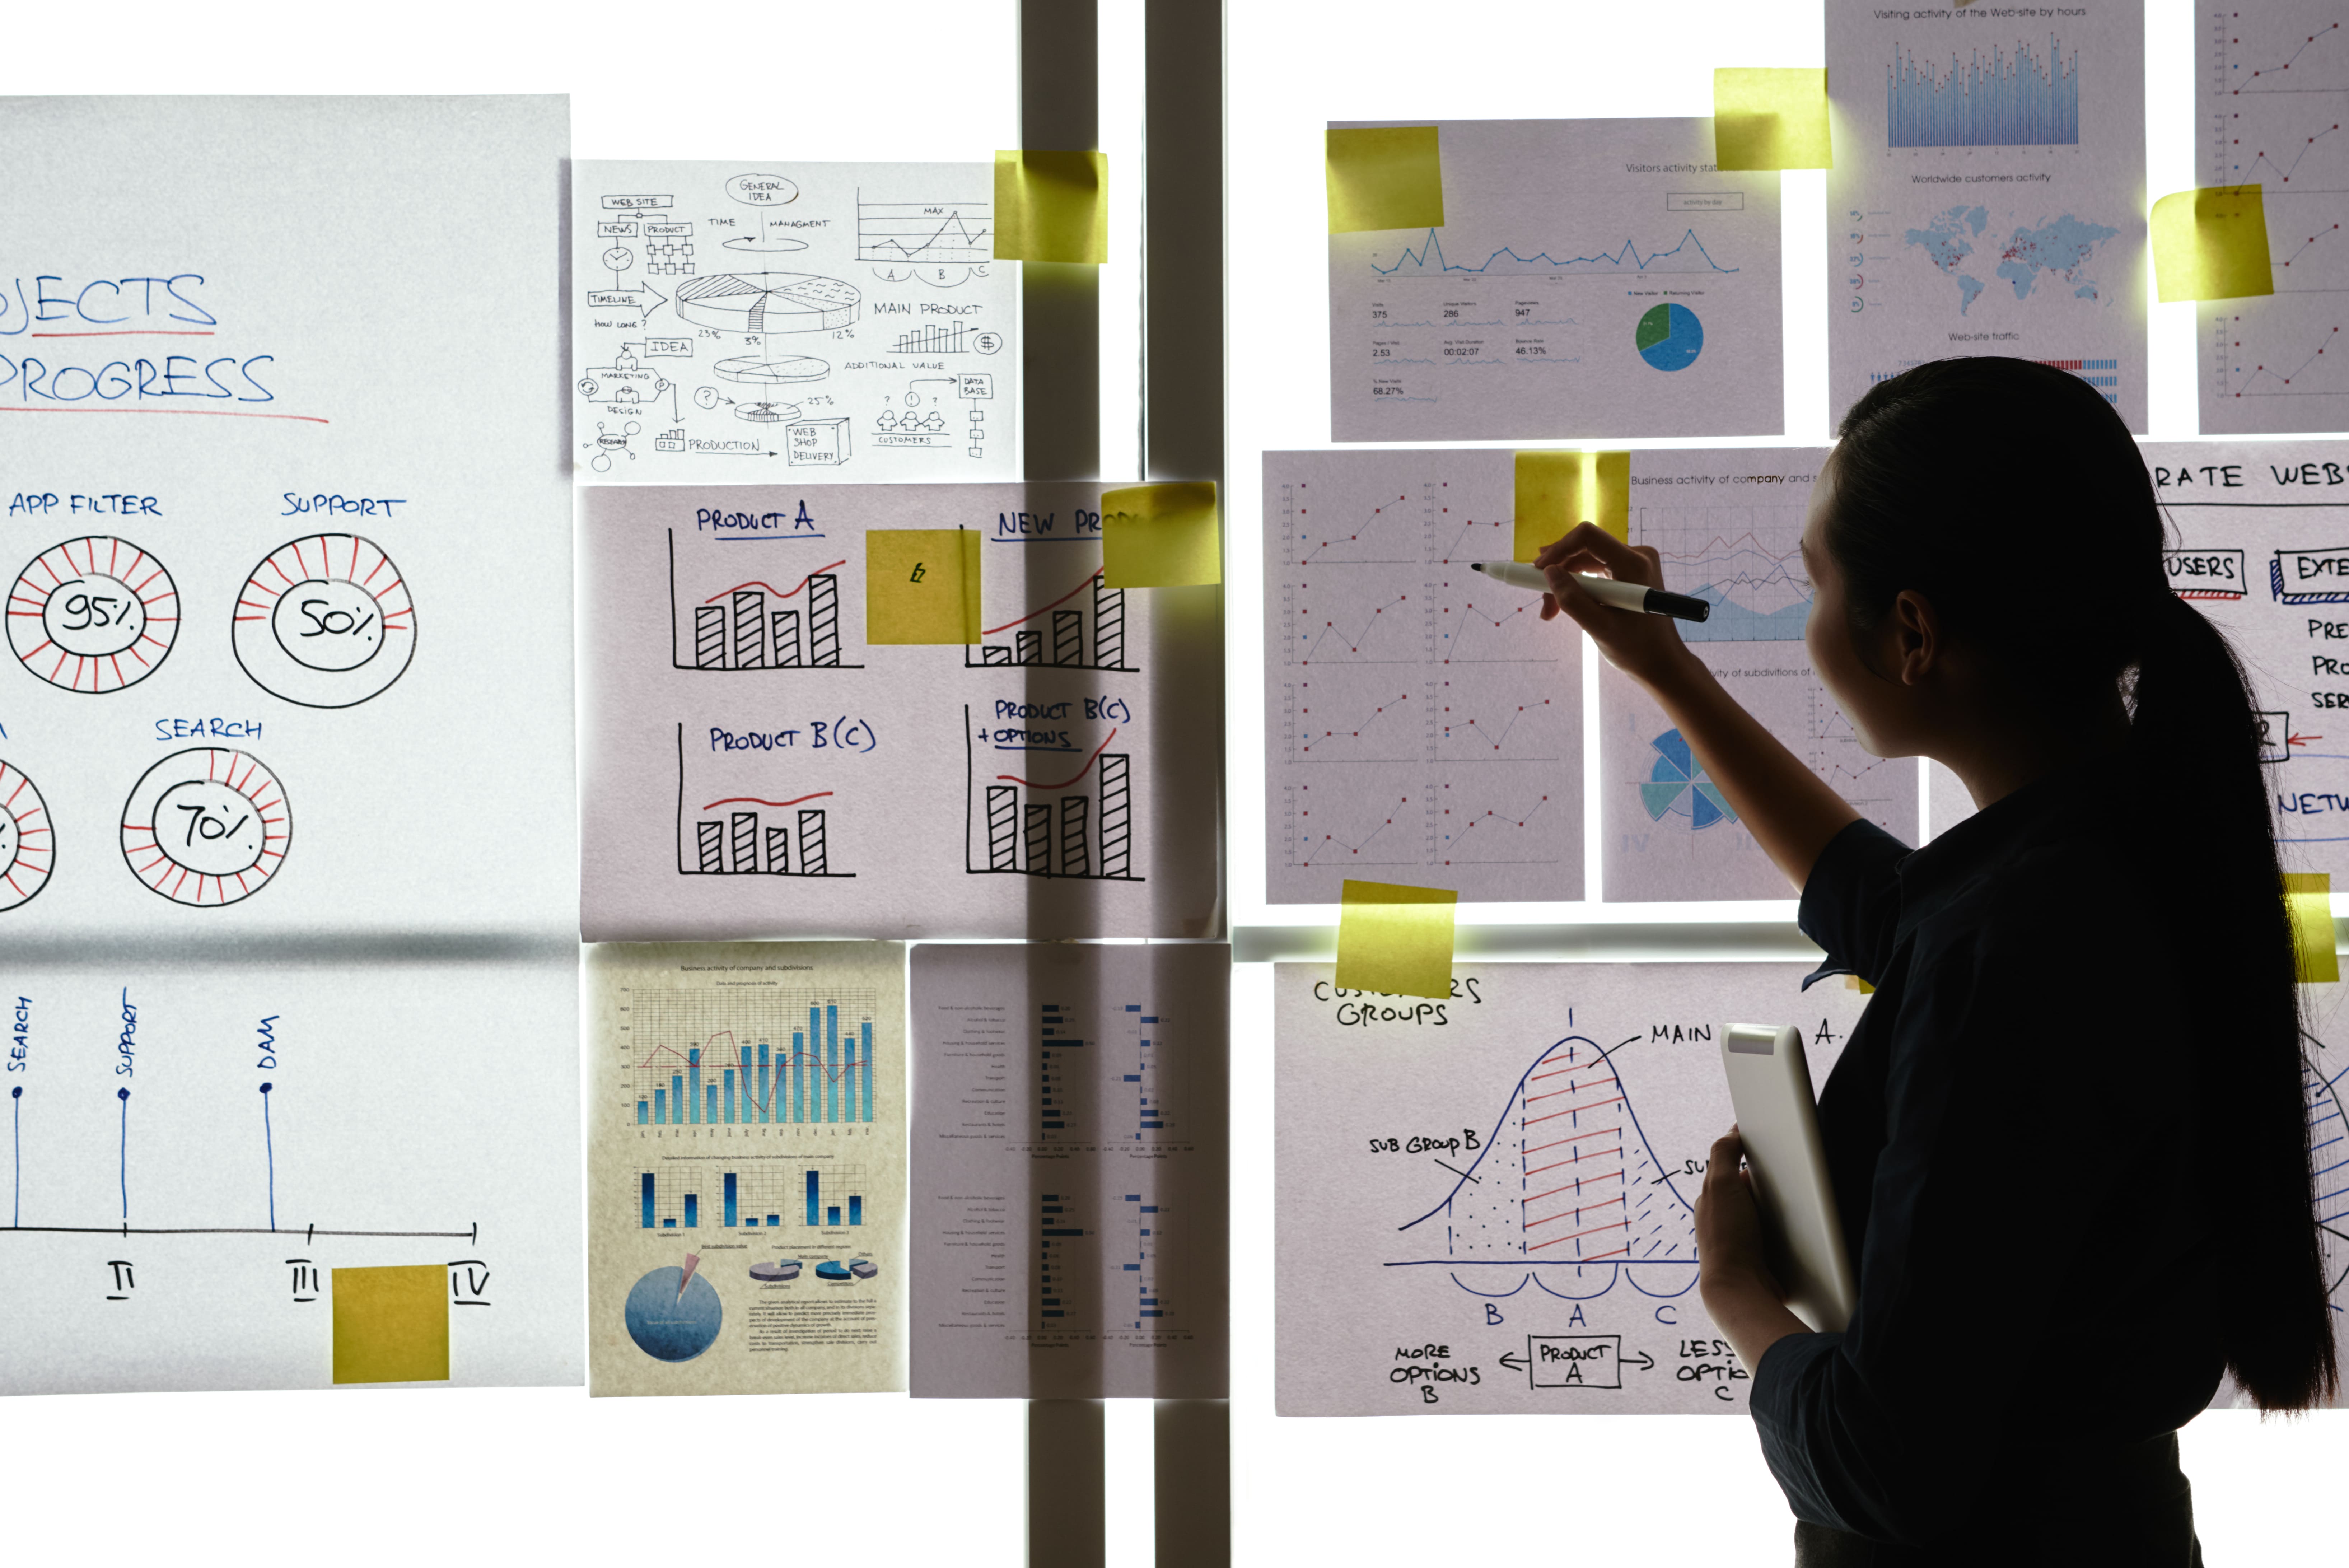
What We Build
From Data to Decisions.
Predictive Analytics
Forecasting models that tell you what's coming, not just what happened. Demand forecasting, customer churn prediction, risk scoring, capacity planning. Built on your historical data, validated against real outcomes, and monitored for accuracy drift.
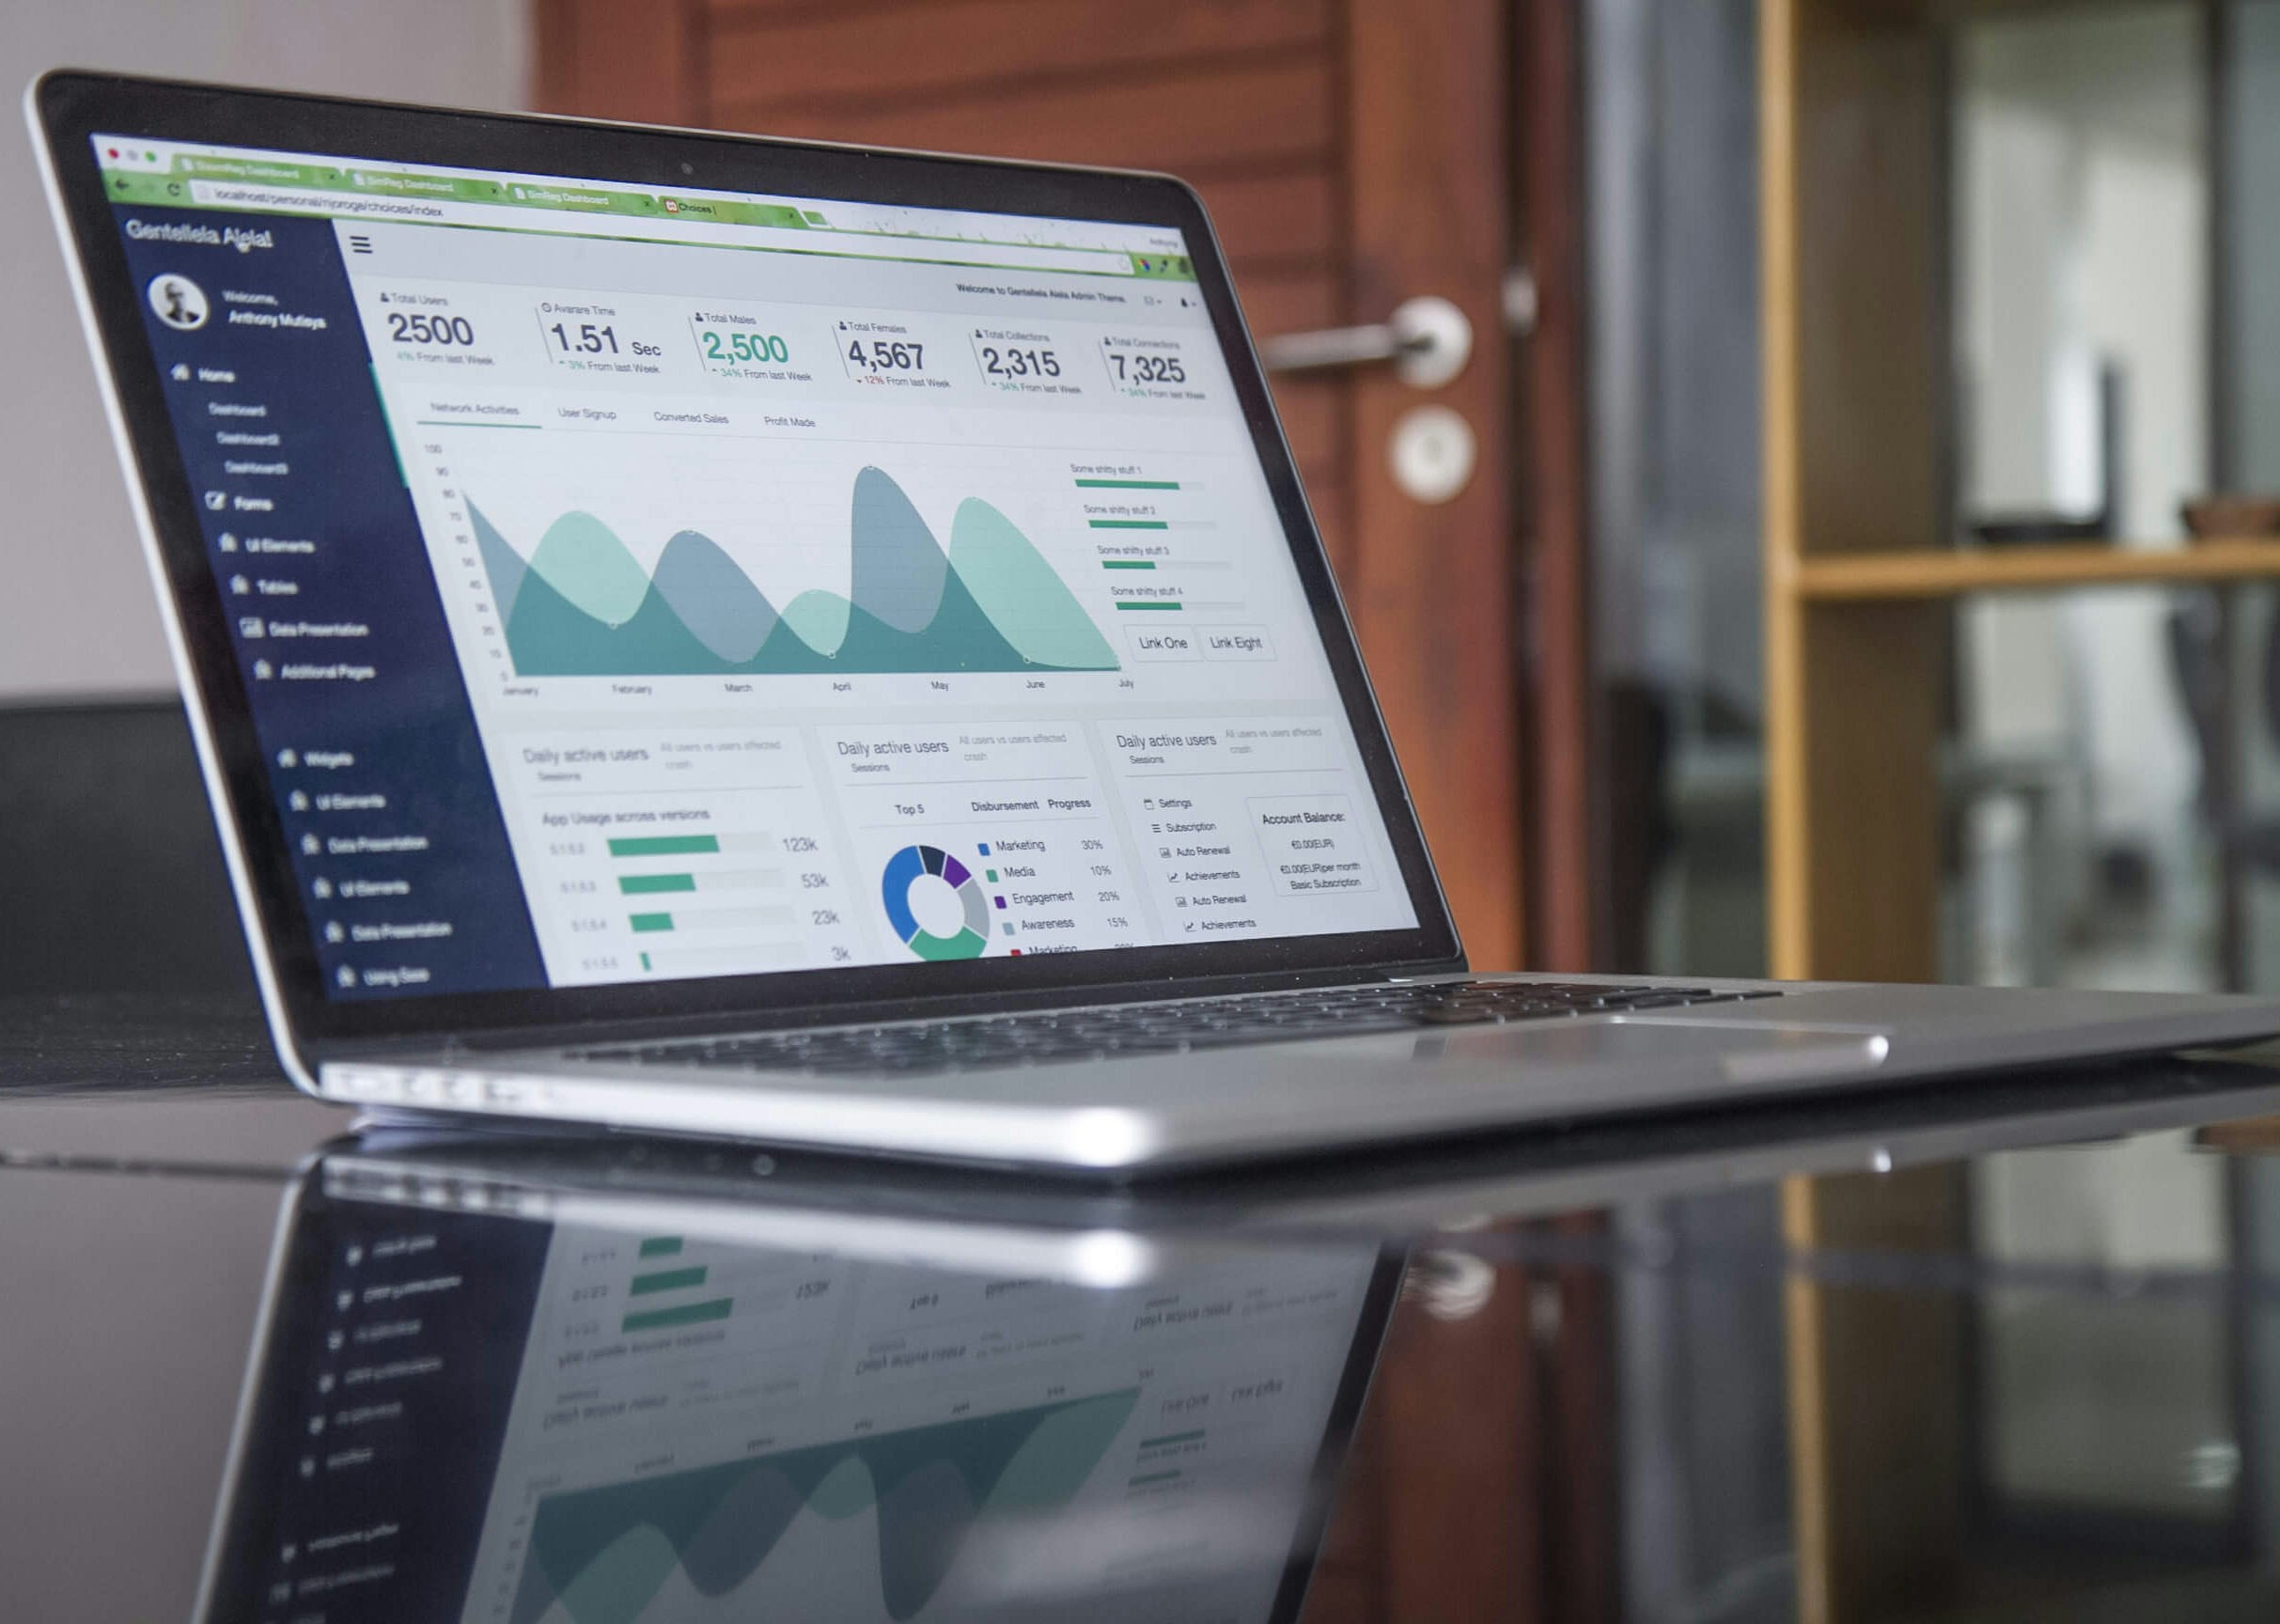
Performance Dashboards
Dashboards designed around decisions, not data dumps. Each dashboard answers a specific question for a specific audience. Executives see strategic KPIs. Managers see operational metrics. Analysts see the detail they need to investigate.
Data Visualization
Power BI, Tableau, KNIME, and custom visualization platforms. We build visualizations that communicate clearly to non-technical audiences. No chart junk. No vanity metrics. Just clear answers to real questions.
KPI Frameworks
Before you build a dashboard, you need to know what to measure. We work with leadership to define the metrics that actually drive decisions. Revenue drivers, operational efficiency indicators, risk metrics, compliance measures. Defined once, measured consistently.
Trend Analysis
Patterns over time that inform strategy. Seasonal trends, market shifts, customer behavior changes, operational performance trajectories. Automated trend detection that surfaces what matters without requiring manual analysis.
Anomaly Detection
Automated alerting when something deviates from normal. Transaction anomalies for fraud detection. Performance anomalies for quality issues. Cost anomalies for budget control. Confidence-scored so your team investigates real issues, not noise.
Forecasting Models
Statistical and ML-based forecasting for revenue, demand, capacity, and risk. Models that improve over time as they ingest more data. Backtested against historical actuals so you know the accuracy before you trust the forecast.
Platforms
Built on Tools Your Teams Already Know.
Power BI
Microsoft ecosystem integration, self-service analytics, enterprise governance.
Tableau
Visual analytics, data exploration, storytelling with data.
KNIME
Open-source analytics, data science workflows, no-code/low-code modeling.
Looker / Google Data Studio
Cloud-native analytics, embedded reporting.
Custom platforms
When off-the-shelf tools don't fit, we build custom analytics applications.
We don't push a single vendor. We recommend and build on whatever tool fits your team, your data, and your existing stack.
Industry
Analytics Built for Your Sector.
Banking
Risk & Regulatory Analytics
Credit risk dashboards, regulatory reporting automation, portfolio performance analytics, AML alert triage with false positive reduction.
Healthcare
Clinical & Cost Analytics
Clinical outcome tracking, patient flow analytics, cost-per-case reporting, population health dashboards with PHI controls.
Transportation
Fleet & Route Analytics
Fleet utilization dashboards, route efficiency and on-time performance analytics, fuel and maintenance cost tracking, delivery SLA reporting.
Usually it's one of three things: the data behind the dashboards is stale or inconsistent, the metrics aren't tied to real decisions, or the dashboards were built by IT without input from the people who use them. We fix all three.
Reporting tells you what happened. Analytics tells you why and what's likely to happen next. Most enterprises have reporting. Few have analytics that actually change decisions.
A focused dashboard build (one department, defined KPIs): 4 to 8 weeks. A full analytics platform implementation: 12 to 20 weeks. Enterprise-wide BI transformation: 6 to 12 months.
In most cases, yes. The question is data quality, not data volume. We assess your data first and tell you honestly whether it's ready for predictive modeling or needs cleanup first.
Let's Talk
Book a Consultation
Tell us about your goals and one of our experts will reach out within one business day.